Posted October 11, 2021

By Zach Scheidt
2 Great Chart Setups for When You're Ready to Buy Again
We've weathered some volatility over the past couple of months!
If you're here reading Rich Retirement Letter and making smart decisions with your investments, pat yourself on the back
It's not easy to keep your head when so many on Wall Street and in the financial news media are panicking.
But here at Rich Retirement Letter, we're keeping a balanced approach. We're looking at the market objectively.
And we're making strategic decisions based on the facts — not based on the whims of day-to-day market shifts.
Over the last few weeks, we've been looking at chart patterns to learn what these tools can tell us about our favorite investments.
Given the recent pullbacks, I thought today would be a good day for us to look at some bullish chart patterns.
That way, you can pick out the stocks most likely to rebound — giving you the best chance to grow your wealth heading into the end of the year.
Reminder: Charts Tell a Story, But They Don't Prophesy
I used to be very skeptical about making investment decisions based on chart patterns.
When I started my investment career at a hedge fund, I prided myself on only looking at the fundamentals of a company.
I didn't think it should matter where a stock used to trade. So historic stock charts were of little value to me.
But thanks to my boss and mentor Bill, I finally came around to using charts alongside fundamental research.
You see, charts can be helpful because they tell us about the decisions that other investors have made...
When you look at a chart pattern, you can see where buyers stepped in and drove the stock price higher... where sellers pushed a stock price lower... and you can pick out certain areas where a large number of investors may feel pain or greed.
None of this information changes what a company is worth. But it can give you clues about what prices other investors are looking at and where they may buy or sell their shares.
So when I look at the chart of a particular stock, I don't consider any pattern to be a fail-safe indication that something will or won't happen.
But charts can be great tools to help you make buy and sell decisions based on your view of what other investors have done.
And the chart tool should be used alongside a deep understanding of what a company does, how much profit it generates, how the industry is evolving and more.
With that caveat in place, let's look at two of my favorite chart patterns to help me know when it is time to buy!
The Reverse Head and Shoulders — "No Fear!"
Back on Sept. 30, I shared two bearish chart patterns I consider to be red flags for your investments. If you see these patterns show up in one of the stocks you own, it's important to take a close look at what's going on.
One of those patterns was the head and shoulders pattern. This bearish pattern looks like three "humps" with the middle one higher than the other two.
When a stock tries to rally a third time and that rally fails, fear can set in and investors often start selling quickly.
By watching for the head and shoulders pattern (and getting out of your shares when it shows up) you can avoid this panic selling and keep more capital in your account.
The reverse head and shoulders pattern tells us a very different story.
It's a pattern that shows fear is leaving the market which can mean big profits are on the way.
The chart below is a picture of the Energy Select Sector SPDR Fund (XLE). This is a basket of energy stocks — an area that has been quite strong this year.
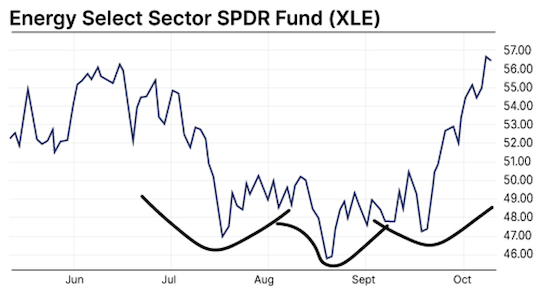
This summer, energy stocks started to trade lower before staging a small rebound in July. But that rebound was short-lived and energy stocks hit a new low in August.
From there, these stocks finally got some traction before one final pullback in September.
You can see in the chart above, the pullback in September was much less severe. It was basically a test to see if traders would continue to sell or if most investors were confident enough to hold on to their positions.
Once it became clear that the third pullback wasn't going to cause any more damage, any leftover fear evaporated.
Buyers stepped in and the reverse head and shoulders pattern led to a strong surge for energy stocks!
My guess is that this surge isn't over. And as these stocks break above the highs from June, we could see a lot of buying.
So consider adding some energy stocks to your retirement portfolio!
The Cup With Handle — A "Stop-Start" Pattern
Another pattern I love to see is the cup with handle setup.
This pattern shows up when a stock (or a sector, or even the broad stock market) pulls back for a while before making a comeback.
Then after recovering most (or all) of the pullback, the stock takes a pause — or a second mini-pullback.
Take a look at the bitcoin chart below to see what I mean...
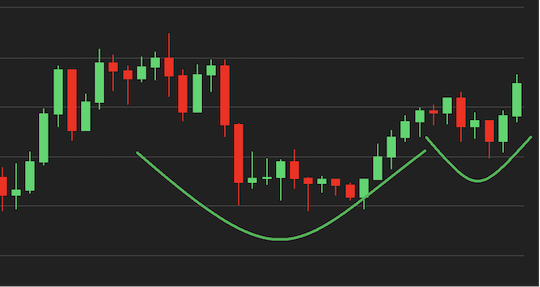
When you see this pattern, something important is happening behind the scenes... human nature is at work!
When a stock pulls back, investors often regret that they didn't sell at the top. We've all had that feeling plenty of times.
Many of us promise ourselves... "If I ever get the chance to sell at that level again, I'll lock in my profit and be done!"
When you see a cup and handle pattern, that handle (or second mini-pullback) is typically because those traders are back to even — or back to the profit they feel like they should have booked — and they're bailing out.
Once these investors are gone, the stock is free to continue moving higher. And often this pattern leads to a much longer-term bullish move!
Watch for Bullish Patterns After the Market's Pullback
I'm bringing up these patterns today because many quality stocks have pulled back over the last few weeks.
If you start with a watch list of your favorite stocks... and you fill that watch list with companies that have reliable profits, pay great dividends and have a strong financial position... you'll be in great shape.
Next, check in on these stocks every few days to see if one of these bullish patterns is showing up.
Buying after a reverse head and shoulders — or cup with handle — pattern shows up can be a great way of timing your investment. It can help make sure that your shares are moving in the right direction.
Ultimately, using bullish chart patterns like this can be a great tool to help you grow your retirement wealth more quickly and with less risk.
Here's to living a Rich Retirement!

Zach Scheidt
Editor, Rich Retirement Letter
RichRetirementFeedback@StPaulResearch.com

How Others’ Incompetence Costs You Big-Time
Posted January 17, 2024
By Byron King

Turning Empty Cubicles Into Houses
Posted January 15, 2024
By Zach Scheidt

"Boring AI": Overlooked Opportunity From CES 2024
Posted January 12, 2024
By Zach Scheidt

5 Must-See Predictions
Posted January 10, 2024
By James Altucher

Welcome to Earth, the Mining Planet
Posted January 08, 2024
By Byron King